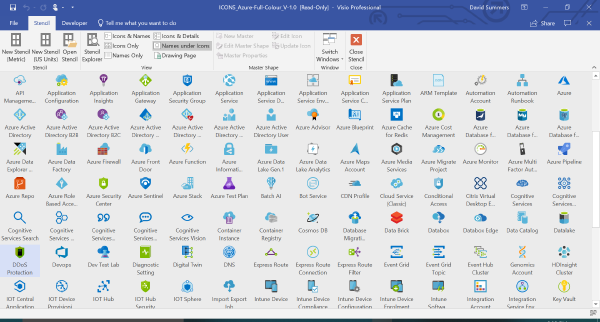
Yes. Visio is still a thing. To draw expressive diagrams with the correct visual representation of the underlying services you need to have access to quality stencils.
If you have not been working with Management Groups to manage Azure at scale, I recommend to review the documentation. You should also take a look at the Microsoft Cloud Adoption Framework (which was just recently updated).
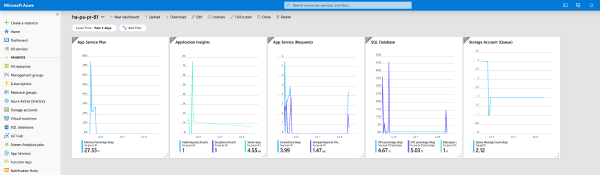
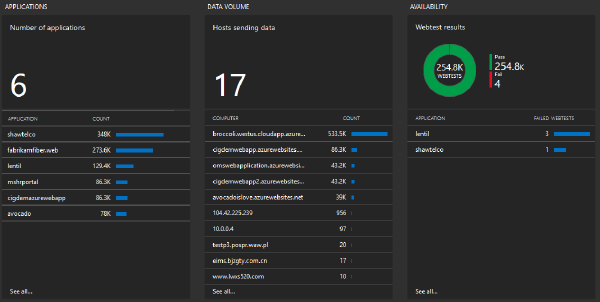
When you begin to operationalize your deployments and want to add monitoring one of the things you might do is to create shared dashboards as part of your deployment. A shared dashboard is basically the same as a non-shared dashboard except it is a full Azure resource, lives in a resource group and can be created through ARM.
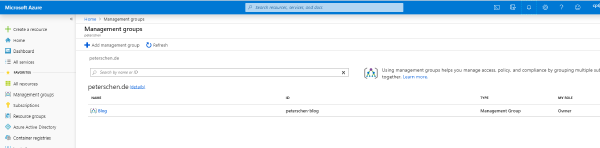
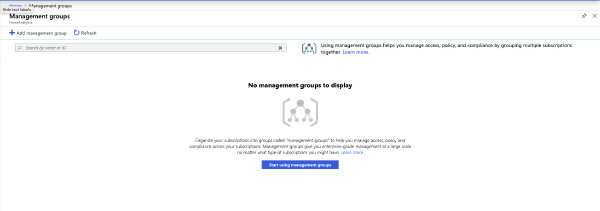
If you use Management groups to manage Azure at scale you may get hit with a bug in the Azure portal, that I discovered today. If you rename the Root Tenant Group the portal stops showing any previously create management groups. Their assignment are still active and you can still manage them using PowerShell or CLI but the portal will start show the out-of-the-box experience.
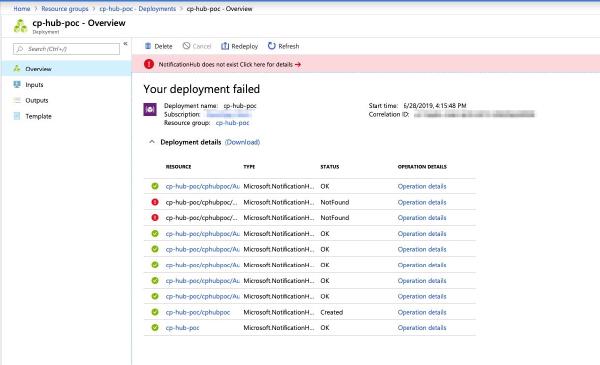
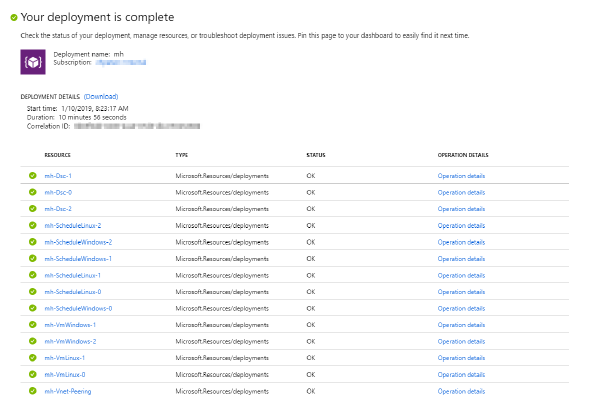
Both development and production environments are deployed in a fully automated fashion using ARM templates. As part of these deployments we also create Notification Hubs and related authorization rules.
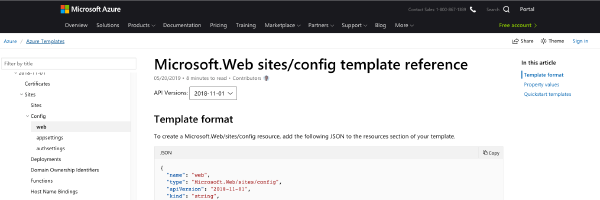
For automatic deployment of test environments we are spinning up App Service instances and want to automatically set connection strings for the database and other services in the same template.
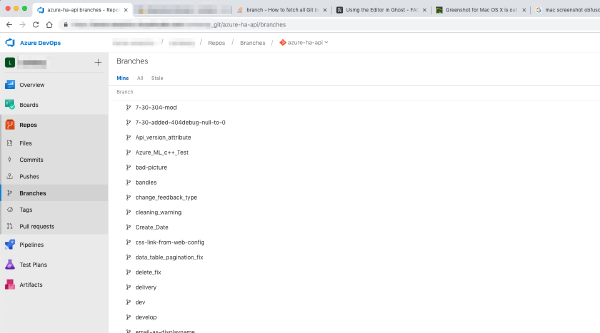
In my first days at HorseAnalytics, one of the first tasks was to review the codebase and streamline the build and release process. That meant to move all repositories over to Azure DevOps so that we can use the pipelines to build and release new versions of our products.
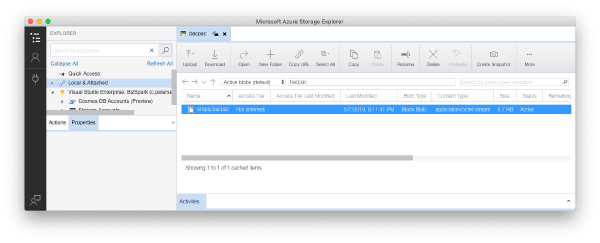
Today I needed to create a test database for one of the products I’m working on. In the backend it uses LINQ to SQL against a SQL Azure Database. Exporting the production database and cleaning it up with millions of records in it turned out to be not the most efficient way of creating an empty test database.
After spending close to eight years in different roles at Microsoft, my time with Microsoft has come to an end. I accepted a new role, starting on May 1st, as Chief Technology Officer with HorseAnalytics an animal tech startup focused on providing a telemetry data platform for horses.
Governance is one of the major adoption challenges when it comes to cloud computing. Organizations find themselves “not ready” to consume cloud services whether that perception is more a gut feeling or comes from experience.
Deploying resources and workloads at scale requires a healthy amount of automation. Automation helps to deliver consistent and repeatable results. I’ve tried to categorize some of the technology and provide some pointers to areas of application and pros and cons.
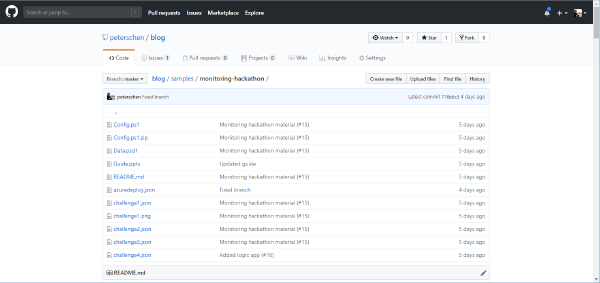
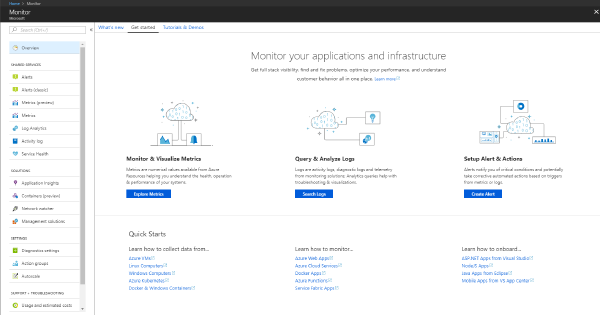
A request that I get many times is to provide guidance and best-practices on how to implement monitoring and operations management with and/or for Azure. Most organizations have subtle differences which makes it hard to put out a generic concept of how to enable this. There are high-level ideas but in my discussions with customers and partners I’m hearing that this is not detailed enough.
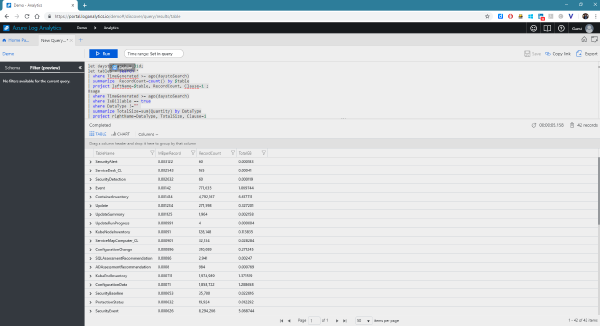
I’ve learned about a “hidden feature” recently that enables some cool scenarios. Log Analytics or Azure Data Explorer aficionados will probably know all about functions already but for Application Insights this has not been documented yet and is not visible through the Azure portal.
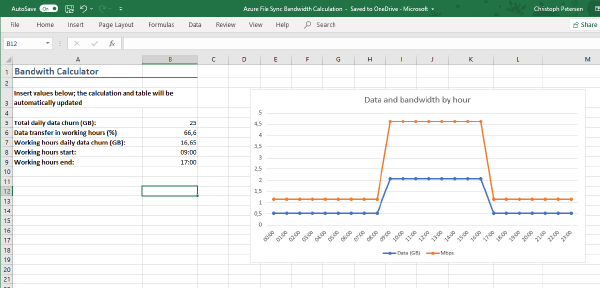
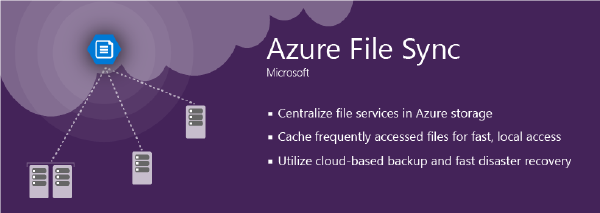
When deploying Azure File Sync one question many customers routinely ask is how the network bandwidth required can be calculated. This depends of course on a variety of factors.
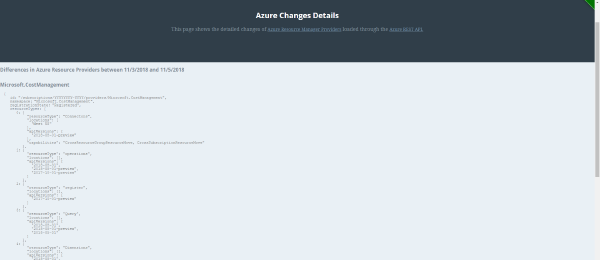
A colleague of mine, Tyler Ayers, has written a pretty neat Azure Function that tracks changes made to Azure Resource Manager Providers (ARM) and show these changes in a timeline.
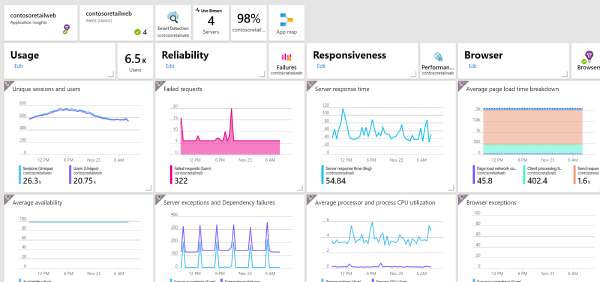
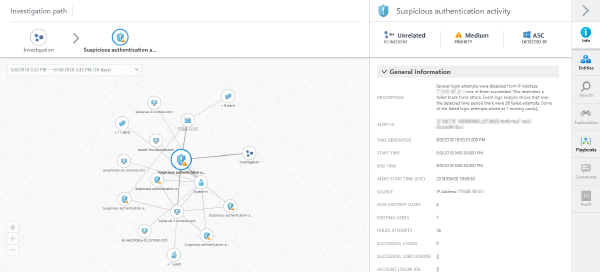
This is why my job is so much fun. I have been working with the CISO of a large retailer that operates multiple independent web portals (some with shopping functions enabled).
In February I had the chance to attend a session by Yuri Diogenes, Program Manager at Microsoft, on how Azure Security Center works and how to demo it in a real life scenario.
Azure File Sync lets you tier data from on-premises systems to a cloud share based on Azure File. Local nodes can act as hot-caches, caching data based on access and modification patterns. Azure File Sync supports multi-master sync so that you can deploy those caches to multiple offices and replicate data across your organization.
Yesterday Microsoft announced the evolution of DevOps. Or rather the evolution of DevOps tooling from Microsoft known as Visual Studio Team Services: Azure DevOps.
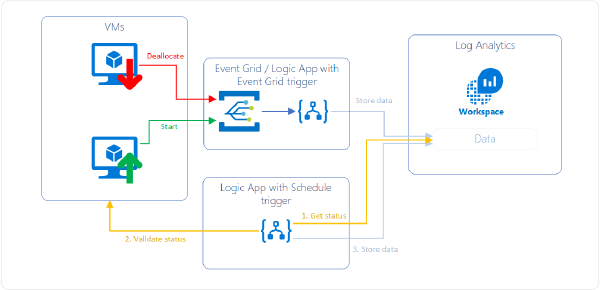
This problem is probably as old as there are monitoring tools on the market. “How can I exclude legitimately deallocated VMs from alerting” is a question that I’ve heard many times.
This problem is probably as old as there are monitoring tools on the market. “How can I exclude legitimately deallocated VMs from alerting” is a question that I’ve heard many times.
This problem is probably as old as there are monitoring tools on the market. “How can I exclude legitimately deallocated VMs from alerting” is a question that I’ve heard many times.
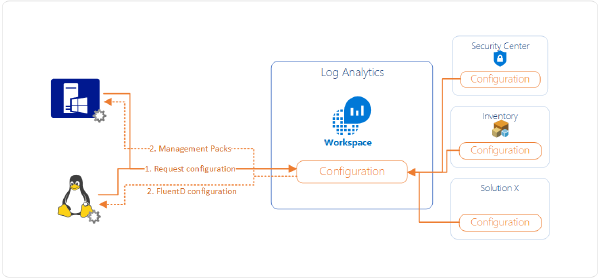
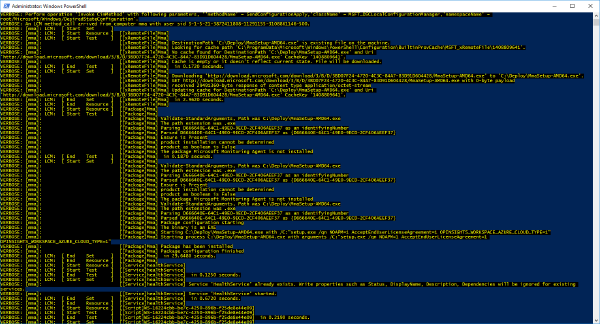
I’ve had a question today coming from a colleague that has no prior experience in System Center Operations Manager (SCOM). He wanted to know how data flows from connected agents (regardless of Windows or Linux) to Log Analytics and subsequently to Azure Security Center.
Every once in a while you might need to create an alert which runs a Log Analytics or Application Insights query. When designing the alert you need to define some attributes: the query, the time period, the frequency and the threshold.
A customer of mine had the following rule configured:
It was his expectation that this rule would be triggered when in the last five minutes at some point more that 200 requests/s were being made to the App Service. Unfortunately this is not the case. The rule will sum the number of requests for the last five minutes and if that number is > 200 the rule will trigger.
The Microsoft Monitoring Agent is able to send data to more than one workspace at the same time. Unfortunately only a single workspace at a time can be configured through the Azure Portal.
Security is top of mind for most Azure customers. To have peace of mind when it comes to security for assets running on Azure, Microsoft continuously works to improve on the security recommendations Azure Security Center provides:
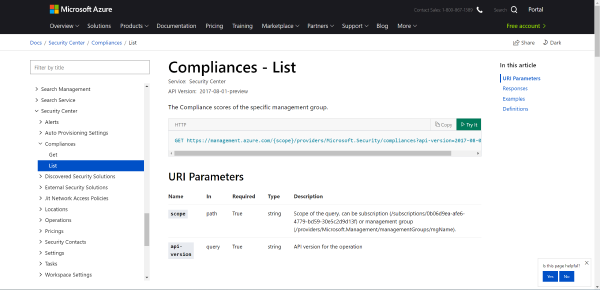
It just has become easier to manage Azure Security Center at scale. While not all aspects of Azure Security Center can be automated yet Microsoft just released updated Swagger definitions for working with Azure Security Center. This includes an updated documentation where you can directly try requests to the API against your tenants you have access to.
In a time before cross-resource queries were possible the Application Insights Connector would copy data from Application Insights to a Log Analytics workspace. With the emergence of cross-resource queries the duplication of data is not required anymore as queries can be sent to both (or even more) entities at the same time in real time.
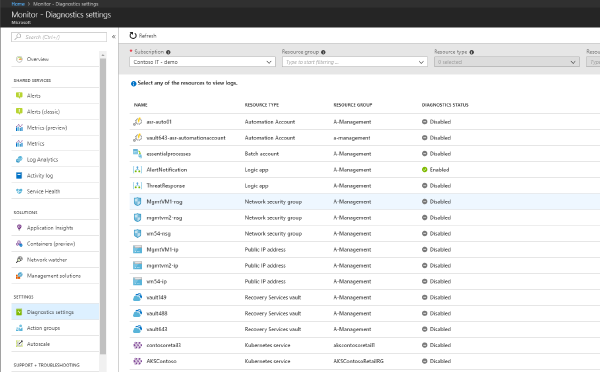
If you are archiving diagnostic logs or activity logs to a storage account through Azure Monitor be aware that on Nov 1, 2018 there will be a breaking change in the format.
When using Azure Backup to manage (geo-)distributed backups across a company you may find that the Azure Backup Reports with Power BI is limited to a single storage account. Unfortunately the reporting telemetry coming from Azure Backup needs to be written to a storage account that is in the same region as the Recovery Services Vault.
Photo by Ilya Pavlov on Unsplash Change Tracking is a versatile feature that allows to monitor changes on a system (both Windows and Linux). Change tracking covers software installation, changes to services, daemons, Registry and the file system. This is available for both cloud based (Azure, AWS, GCP), on-premises and service provider hosted systems (given network connectivity to Azure).
Photo by Matt Artz on Unsplash In many scenarios there is the requirement to enrich or lookup data with meta information from the infrastructure. In this scenario a file with machine, location and other meta information was placed during deployment on the VM for both Azure and AWS.
Photo by rawpixel on Unsplash When setting up Azure File Sync one of the requirements is to have the Azure PowerShell Cmdlets (AzureRM) installed. Many customers have proxies deployed which control internet egress. Many of these also use authentication to secure internet access.
Photo by rawpixel on Unsplash I like to share on LinkedIn and asked myself why I’m not sharing the articles I write for my blog. The you-just-have-to-do-it factor, plain laziness and lack of time are the primary reasons why I have not posted links to LinkedIn so far.
Photo by rawpixel on Unsplash Currently billing for Azure Security Center is reported on a per-node, per-month basis. Starting July 1st 2018 this reporting will be changed to per-node, per-hour to achieve more granularity in billing. Billing is still pro-rated thus you’ll only pay for the time a node was actually using the service.
Centralized integration with an identity provider is a common ask. It provides increased security and removes the reliance on out-of-band managed user accounts.
Photo by frank mckenna on Unsplash Monitoring the container infrastructure which is running your applications is important. With the emergence of managed Kubernetes such as Aure Container Service (AKS) this becomes more tricky as part of the infrastructure is managed by somebody else.
Photo by Igor Ovsyannykov on Unsplash Important step in bringing SAP on Azure to the customer. The M-series that was GA’ed in December 2017 and is memory optimized (up to 128 vCPUs and 4TB RAM) has been certified by SAP to run services.
Almost all Azure management services run in/for any cloud. Among them is Update Management which automates OS patching for both Linux and Windows machines whether they are running on-premises, in Azure or in other clouds.
An interesting question came up in a conversation today: How are the costs for Azure Security Center Standard pricing tier calculated for nodes that are stopped?
Azure Policy is a great tool to define governance controls in Azure. With addition of the compliance pieces this feature which was part of Azure for quite some time finally had it’s appearance on main stage (deep dive on implementing governance at scale in this video from Ignite 2017 by Joseph Chan and Liz Kim)
Nearly every customer I talk to about Azure management asks me this: “How can I do process monitoring?”. As there is currently no way to directly instrument either the Windows or the Linux agent to do explicit process monitoring another way need to be found.
Around Ignite 2017 Azure Security Center was migrated to use Log Analytics as its foundation both for collecting data through the same agent and storing most of its data.